Overview
In this blog we will explore making and testing an outdoor enclosure for the Kitronik Air Quality Control HAT for Raspberry Pi.
The library and example code for the Air Quality Control HAT can be found on our GitHub repo.
What you’ll need:
- Kitronik Air Quality Control HAT
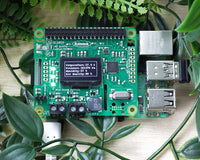
- Raspberry Pi 4 Model B
- White Fluted Polypropylene Sheet
- Clear Acrylic Sheet
- Hot Glue Gun
- UK Raspberry Pi 4 Power Supply
Outdoor Enclosure Design
Below is a diagram to show the different sections of the outdoor enclosure are built up in the CAD file. This file will be used to laser cut the pieces of our outdoor enclosure. On the left we can see the front panel which we want to cut out of clear acrylic. Then on the right we can see the reset of the enclosure pieces which we want to cut out of white fluted polypropylene.
At the top of our white fluted polypropylene section we can see the roof piece. This is a few centimetres wider than our enclosure to provide some overhang on each side to protect the inside of the enclosure from the rain.
The enclosure has a second, inner roof that is placed just above the Raspberry Pi and Air Quality Control HAT. This will stop any droplets of rain that have been blown into the enclosure by the wind from landing on the electronics.
Below this we then have our other three walls. Each have several sections to cut out in the middle of the walls. These cut outs will be used to slot in the support beams and inner roof.

On the right we can see the base piece, two support beams, and four sets of legs. Inside the base there are lots of little shapes that need to be cut out. The cut outs around the edge will provide sections to slot in the legs and the walls, to help make the enclosure sturdy. In the centre of the base there is a hexagon pattern which surrounds a circle.
The circle should be cut so that only the top layer of plastic has been cut off. This will provide a small hole for the internal fan to be slotted in securely. When cut out the hexagon pattern will provide plenty of holes in the bottom for the internal fan to pull air up into the enclosure. Having a fan to pull air into the enclosure ensures that the Air Quality HAT is measure the outside air and not a microclimate created inside of the enclosure.
Finally, we have the support beams which will have the Raspberry Pi slotted in to. These support beams will have one end placed inside the holes on the back wall and the other placed in the holes on the left wall. They will hold the Raspberry Pi upright and away from the base of the enclosure, as it is possible moisture could build up there over time.
Making the Outdoor Enclosure
We made most of our Air Quality HAT outdoor enclosure using white fluted polypropylene for most of the structure. The front panel of the enclosure was made using clear acrylic to provide easy viewing of the Air Quality HAT to check everything was working properly.

We began making the enclosure by gluing the four legs onto the base. Each leg is made up of two pieces that interlock and slot into the base. To make the legs sturdy, it is a good idea to glue the two interlocking pieces of the leg together and glue them into the base.

Next we want to attach the back and left side panels onto the base. We’ll put these into place first so we have plenty of room for attaching the support beams that the Raspberry Pi will sit on. Similar to the legs, all of the wall panels interlock with each other. On the wall panels we want to put a line of hot glue across the bottom of the wall where it connects to the base. We also want a line of hot glue on the inside of the walls where the two panels meet.

Let’s now move on to attaching the support beams for the Raspberry Pi. We want to make sure the holes in our support beams are facing upwards so we can slot our Raspberry Pi in later. Slot the support beams into the two walls and fill in any gaps in the walls with hot glue. This will stop water from being able to get in to the enclosure.
With the support beams in place, the inner roof and other side wall could now be glued onto the enclosure. The right side wall needs a line of hot glue along the base and up the wall where it connects to the back panel.

The inner roof also wants to be hot glued into place. On top of the inner roof we want to put hot glue where it connects to both walls to fill any gaps that could let water drip in to the enclosure. There should also be hot glue connecting the inner roof to the back wall, but be careful not to fill the drainage hole.

Finally, we can hot glue the roof onto its supports. Try to line up the roof so that there is an equal overhang on each side. At this point we can also place in the front panel made from clear acrylic. We might not want to hot glue this in place yet as we haven’t tested our enclosure is water-tight. However, if you do glue it in place and want to make some changes inside of the enclosure, then it is reasonably easy to remove the front panel by peeling off the hot glue.
Testing the Outdoor Enclosure
To test the outdoor enclosure we first wanted to ensure that the Raspberry Pi and Air Quality Control HAT would not get wet when it started to rain outside. We tested this by filling the inside of the enclosure with scrap pieces of paper. Then we took the enclosure outside and poured water on top of it using a watering can. We tried pouring the water at different speeds and from different angles to simulate rainfall in a range of weather conditions.

From this test we found that none of our simulated rainfall was able to get onto the paper, as all of the paper was still completely dry when we took it out.
Running the HAT Outside
To run the Air Quality Control HAT we created a Flask web dashboard that we could connect to remotely and monitor the HAT. The code for the Raspberry Pi web dashboard can be found on our GitHub repo.

Before taking the Air Quality HAT outside we needed to slot the Raspberry Pi into our support beams and setup the fan in the base. Then we could hot glue the clear acrylic front panel in to place.
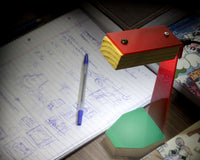
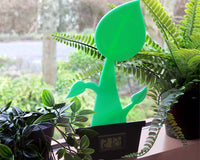
To run the Air Quality HAT outside, we suspended it from a window. We did this by removing the legs and tying some string to the base of the enclosure. The four pieces of string then passed through four small holes we made in the roof before tying them together on the top of the enclosure. This allowed us to hang the Air Quality HAT from a window and have the Raspberry Pi power supply inside the building.
It is important that the cable providing power to the Raspberry Pi has a drip loop. A drip loop is the slack in the power cable that can be seen in the bottom left of the photo above. This slack hangs lower than the power connector attached to the Raspberry Pi. The drip loop ensures that any water which falls onto the power cable drips down the wire, away from the connectors on either end, and will drop off the bottom.

With everything setup we could now start the web dashboard running and have the Air Quality HAT periodically measure the air quality outside.
Outdoor Air Quality Data
We ran the Air Quality HAT in its outdoor enclosure for five days. Over the five days the Air Quality HAT was constantly measuring the air quality but would only store a reading of the air quality once every 10 minutes. If we were to read and store the air quality data more frequently than 10 minutes then we would have gathered way more data than we need. However, to keep the air quality readings accurate, it is important to measure the air quality every few seconds.
Let’s have a look at the data we collected and compare the different air quality metrics to the data recorded at timeanddate.com.

Above is a graph showing the temperature measured by the HAT (in blue) in comparison to the recorded temperature (in grey). We can clearly see that the HAT temperature follows the recorded temperature’s trend very closely. The HAT temperature is about 2 degrees Celsius higher than the recorded temperature. It is important to remember the air quality HAT is inside of a small enclosure with limited air flow and has a Raspberry Pi constantly running. As the Raspberry Pi can generate a good amount of heat, it is unsurprising that the HAT’s temperature readings are a couple degrees higher than the actual outside temperatures.

Above is a graph showing the pressure measured by the HAT (in blue) in comparison to the recorded pressure (in grey). The graphs show the HAT pressure follows a similar pattern to the recorded pressure. The air quality HAT measured the pressure about 700 pascals lower than the recorded pressure. This is not a large difference in pressure and is likely caused by the readings being taken from two different locations. Changing where you measure the pressure will naturally cause different pressure values as the pressure is different depending on where you are.

Above is a graph showing the humidity measured by the HAT (in blue) in comparison to the recorded humidity (in grey). Again we can see the humidity readings by the HAT follow the same trend as the recorded humidity. The air quality HAT measured a humidity of about 20 percent lower than the recorded humidity. This makes sense as the temperature inside of our enclosure, where the HAT is measuring, is a couple degrees higher than the outside temperature. The difference in temerature causes a lower humidity percentage because warmer air can hold more water vapour than colder air. This means that we can have the same amount of water vapour in the air, but as warmer air can hold more water vapour the percentage in the air is lower.

Finally, we collected the estimated CO2 and air quality percent measured by the HAT. The estimated CO2 and air quality percent are calculated based on data from the gas resistance, humidity and temperature. The expected CO2 levels are between 400 parts per million and 1000 parts per million. The expected air quality percent is between 80% and 100%, where anything above 90% is considered excellent air quality. Anything below 80% is considered polluted, with the level of pollution increasing the lower the air quality percentage.
As we can see from the graph above, the estimated CO2 levels (in blue) range from about 300 parts per million to 1000 parts per million. This is the expected range for the CO2 levels and it is important to remember the air quality HAT is simply estimating the CO2 levels and cannot necessarily measure them with high accuracy. The air quality percent (in orange) is also within an expected range from about 80% to 100%. We can see from the graph that the air quality percent and estimated CO2 have an inverse correlation. When the eCO2 levels increase, the air quality levels decrease. And when the eCO2 levels decrease, the air quality levels increase.
©Kitronik Ltd – You may print this page & link to it, but must not copy the page or part thereof without Kitronik's prior written consent.